
 The US economy is showing signs of potential weakness, with several indicators pointing towards a possible recession. Here's a summary of the current state of the US economy:
Despite these concerns, the stock market has remained resilient, with the S&P 500 up double digits. However, bank credit growth is near 0%, and credit card debt is soaring. The Federal Reserve has raised interest rates multiple times in an attempt to control inflation, which could further impact the economy. While there are signs of economic slowdown, the overall consensus is that the Fed will have to cut rates in the coming years as inflation comes down. However, the economy is not slowing down as much as expected, and the unemployment rate remains relatively low. In conclusion, while there are risks of a recession, the US economy has shown remarkable resilience over the past couple of years. It remains to be seen whether the economy will achieve a soft landing or if a recession is on the horizon. However, economist predict that there is a 50-70% we are heading into a economic recession. The indicators above support this. Des W Woodruff
linkedin.com/in/deswoodruff
0 Comments
 What Is Intraday Trading?Intraday trading, otherwise known as day trading, is simply the practice of buying and selling stocks or other securities within the same trading day. In this approach, all positions are closed before the market closes for the trading day, with the intention of profiting from short-term price movements. Intraday traders (i.e., day traders) seek to bank on the fluctuations in the prices of stocks, currencies, futures, or other financial assets that occur within the trading hours of a single day. They do not hold their positions overnight, thereby avoiding the risk of price gaps that can occur after the market closes. Intraday trading requires quick decision-making, a comprehensive understanding of market trends, and most importantly a thorough trading educational foundation. It often involves the use of technical analysis and real-time market data. Intraday trading contrasts sharply with long-term investment approaches, requiring traders to capitalize on minute by minute market fluctuations to make decisions quickly and efficiently. Intraday Trading Video ExampleWe learn best visually, right? The video below shows a great example of what an intraday trade looks like. From pattern identification to trade management, this recap will give you a good understanding of how an intraday trader operates. The Pros and Cons of Intraday TradingIntraday trading, while offering significant opportunities, also comes with its own set of challenges: Pros:
Cons:
11 Most Popular Intraday Trading StrategiesIf you’re going to day trade, your success will depend on your ability to hone in on a strategy (otherwise, you’re nothing more than a gambler). Here’s a list of common intraday strategies, each with its unique approach and risk profile:
It's important to note many traders utilize techniques from multiple of the above listed strategies, and there is no one strategy that is more profitable or important than another. What matters is that you're consistent in sticking to whichever intraday strategy that you choose. Intraday Trading Tools and Technical AnalysisThe right tools and analysis methods are pivotal for intraday trading:
How To Find The Best Stocks For Intraday TradingNo matter how strong your trading plan is or how disciplined your trading approach, it all falls short if you're trading the wrong stocks. Picking the right stocks is crucial in intraday trading and involves several key considerations:
Most day traders utilize an intraday stock scanner (also referred to as an intraday stock screener) to find stocks that fit their specified trading criteria. For example, chart pattern traders are likely to use a stock scanner to find stocks that have higher than average trading volume (i.e. Relative Volume) and that are over a specific price. From that scan, they'll create a watchlist or hotlist of stocks from which they will look for intraday chart patterns. Intraday Trading RegulationsStaying compliant with trading regulations is essential, and the rules will vary from country to country. In the United States, for example, you are required to have a minimum of $25,000 USD in your account to day trade with no limits. Accounts with a liquidity below the $25K threshold will be subject to the Pattern Day Trade Rule which simply means you’ll be restricted from making more than three day trades within a rolling five-business-day period. Moreover, you can still day trade with less than $25,000 in the US– you’ll just have to be more selective with your trades and space them out accordingly. Otherwise, you can steer clear of this regulation by making sure your account stays well above the $25k threshold. Crafting and Refining Your Intraday Trading StrategyDeveloping an intraday trading strategy is crucial as it provides a structured approach to navigating the fast-paced and often volatile day trading market. A well-defined strategy helps traders make informed decisions, manage risks effectively, and capitalize on short-term market movements. Continuous refinement of this strategy is key to adapting to ever-changing market conditions, enhancing the potential for profitability and minimizing unnecessary losses. Developing a robust strategy requires:
Advanced Techniques and ConsiderationsFor experienced traders looking to enhance their approach consider the following:
Final Thoughts: The Journey to Intraday Trading ProficiencyIntraday trading offers a path to potential profits and intellectual engagement with the financial markets. However, it requires a deep understanding of market dynamics, a well-thought-out strategy, and the discipline to execute trades effectively.
One of the easiest ways to get an idea of whether or not intraday trading is for you is to join a chatroom with active day traders. Here at Grok Trade, we offer just that. Learn more about joining our trading free chat room that’s run by GrokGrads of the mentorship program by clicking here.  There’s not a single career (that I can think of) where an individual faces as much uncertainty on a regular basis than that of a stock market trader. In addition to the daily fluctuations of price action that demands specific position management, traders are continually faced with the challenge of adapting to unforeseen news events. These unpredictable events, commonly referred to as Black Swans, have the potential to redefine market dynamics. Unfortunately, the world has just experienced such an event over the weekend with the Hamas assault on Israel, thrusting the nations into war. How is a trader to navigate the markets with such heightened uncertainty? The Art Of Trusting The Visible DataEmotions running high are only natural in the face of a global news event like this. Perhaps even more natural are a trader’s worries and assumptions about how such a crisis might affect the markets and his or her own positions. However, a trader can get into trouble if they allow these assumptions to prompt them into making premature decisions. Tragic news of war breaking out in the middle east doesn’t mean you should run to your broker, close all your longs, and short the markets with all the strength of your available trading margin. Indeed, traders who shorted into this week in anticipation of a massive market drop are likely very disappointed to see the markets marching higher this week as of Tuesday morning (SPY is up +1.46% on the week, QQQ is up +1.38% on the week, and IWM is up +2.23% on the week at the time of this post.) So then– since no one is certain of how other market participants will react to the news, there’s only one logical way to react: trade what you SEE, not what you THINK. Regardless of the cacophony of global opinions, a technical analysis trader's best tool is real-time price action. No, I’m not suggesting you completely dismiss the significance of news and its potential to shift market dynamics. The news IS important, but it should be used more so as an awareness indicator rather than a hard and fast decision-maker. Traders should never rush to initiate or liquidate a position based solely on speculations about how other market players might respond to a specific news event. After all, a trader adhering to a solid trading strategy should already have proactive risk measures in place to protect them from extreme market volatility. Instead, traders should closely monitor how price is reacting to the news, and only if necessitated by their trading plan should they take appropriate actions such as widening stop losses or moderating position sizes. The Steadfastness Of Rational Decision-makingIn the face of earth-shaking events, the importance of calm, rational trading cannot be stressed enough. Making decisions anchored in the actual market trajectory protects you from undue stress and sets the stage for consistent outcomes. Incidents like the Hamas-Israel invasion, while undeniably tragic, should never serve as a basis for making assumptions about market responses. A trader must be cautious to not rely on their gut feelings, intuitions, or preconceived notions and should instead focus solely on what price is doing at the moment. Rely On THIS For Consistent Trading...In the tempestuous realm of trading, a trader's only reliable anchor is a proven, time-tested, rules-based trading plan. Perhaps this sounds like a 'no duh' statement, but it warrants emphasis. Think about it– what do quant funds (algorithmically traded hedge funds) do? At their core, their algorithms adhere to a strict set of predetermined rules to achieve profitability over time. A trading plan aims to do the exact same. While no strategy offers absolute predictability or guaranteed returns, a well-crafted, rules-driven trading plan that's crafted with the guidance of an experienced trading mentor tips the balance in your favor. Removing the guesswork from trading, this plan enables you to navigate confidently through the usual market volatility as well as the rare Black Swan events. The law of averages will eventually work in your favor if you follow such a trading plan with unwavering commitment. The only question is...are you up for it?
After having personally mentored thousands of traders, I cannot emphasize enough the need for traders to have a solid trading education. If you’re considering taking up trading as a side income or full-time income, consider taking our free 101 trading course. It’s a simple yet highly informative six video series that will give you a solid trading foundation and will serve as your starting point on the path to profitable trading. Take my word for it when I tell you that the markets are no place for the uneducated...they will chew you up and spit you out (financially AND emotionally) if you don't know what you're doing. That said, they can be pleasantly rewarding when approached with the right strategy. I highly recommend jumping in to the 101 courses (they're free anyway!) today. Go here: https://www.freeonlinetradingeducation.com/sample-101-video.html -Des Woodruff (aka d-seven) Grok Trade  There's an exciting development stirring in the crypto-sphere. BlackRock, a name you might recognize as the world's largest asset manager (trillions in management), is making a strategic play into Bitcoin. They've filed for a unique beast - the first publicly traded spot Bitcoin ETF in the United States, dubbed the "iShares Bitcoin Trust."
So, let's talk about what a "Spot Bitcoin ETF" is. In essence, a Spot Bitcoin ETF is an Exchange-Traded Fund that mirrors the real-time price, or "spot price," of Bitcoin. What this means is when you invest in such an ETF, you're indirectly purchasing Bitcoin, without the need to manage the nitty-gritty of digital asset ownership (i.e., securing a digital asset exchange and setting up a digital wallet). This is in contrast to a futures-based Bitcoin ETF, like Grayscales GBTC, which tracks the price of Bitcoin futures contracts rather than the actual asset itself. When investors purchase shares in a spot Bitcoin ETF, they are buying into a fund that directly holds Bitcoin, allowing them to get exposure to the digital asset without having to buy, store, or manage it themselves. Let's look at why BlackRock's move could be a game-changer. The iShares Bitcoin Trust is designed to address the concerns that have led to the SEC turning down similar ETFs in the past. Their strategy involves a "surveillance-sharing agreement" with exchanges, with the likes of Nasdaq and a spot trading platform for Bitcoin in the mix. The goal is to share information about trading activities, clearing, and customer identities, aiming to tackle the issue of market manipulation. Now let's answer three burning questions you might have: 1. When will the SEC decide on BlackRock's spot Bitcoin ETF? Unfortunately, there's no set date for a decision. These processes can take quite some time, even several months, and there could be extensions or delays. So, all we can do is wait and watch. 2. What could be the impact of a spot Bitcoin ETF on the Bitcoin market? If the ETF gets the green light, it could significantly shake up the Bitcoin market. It offers a seemingly safer and more regulated way for investors to dabble with Bitcoin, which could draw more institutional and individual investors. This could potentially push demand and Bitcoin's price upward. But keep in mind: market movements are unpredictable and influenced by various factors, so proceed with caution. 3. What are the risks associated with a spot Bitcoin ETF? As with any investment, a spot Bitcoin ETF comes with risks. Its value is tied to Bitcoin's price, which is well-known for being volatile. Regulatory uncertainty around cryptocurrencies adds another layer of risk. Also, the ETF's value depends on the security measures in place by the Bitcoin custodian—in this case, Coinbase Custody Trust Co. Any breach there could have repercussions for the ETF. And of course, there's the usual lineup of risks associated with any ETF, such as liquidity and market risk. As always, it's vital to do your homework and consider your risk tolerance before diving in. Last thought At the moment, we're witnessing a high-stakes drama unfolding across the U.S. financial arena. Pivotal events are taking center stage, including the request by BlackRock, the world's leading asset manager, to initiate a spot Bitcoin ETF, and the simmering speculation regarding the proposed U.S. Central Bank Digital Currency (CBDC). Yet, these are merely a piece of the larger picture. Here's the scenario. BlackRock, a behemoth in the asset management realm, is treading into unexplored waters with its recent appeal for a spot Bitcoin ETF. While this groundbreaking move could alter the future of Bitcoin investment, it sharply contrasts with the stringent approach that the SEC is adopting towards cryptocurrency platforms like Coinbase and Binance.US. This brings us to the crucial puzzle piece - 'Operation Chokepoint 2.0'. It's a term being whispered across the industry, representing what many view as an intentional effort by federal authorities to isolate the cryptocurrency industry from essential banking services. This crackdown raises significant questions about what the future holds for digital currencies in the U.S. In the midst of this unfolding narrative, Florida's Governor DeSantis has thrown another twist in the works, choosing to prohibit CBDCs within his state boundaries this year, helping safeguard freedoms. This bold move adds an intriguing twist to the tale, as it creates an additional layer of discord between state and federal stances on digital currencies. To sum it up, we are at the crossroads of a gripping period for digital currency within the United States. We're witnessing an emerging clash between the embrace of digital assets by traditional financial institutions, stringent regulatory actions, the ominous 'Operation Chokepoint 2.0', and the resistance against a potential CBDC by some states. The outcomes of these power plays could profoundly impact the future of cryptocurrency, not just within the U.S., but worldwide. For now, we wait holding our breath to see how the drama unfolds. Remember, investing is a journey. Take it one step at a time. Des Woodruff (aka d-seven) GrokTrade *This article is intended for informational purposes only. It is not intended to be financial or investment advice.*  What is a CBDC and why should we care?
You have heard of cryptocurrency (think Bitcoin, Ethereum, etc.). Well, the US Central Bank Digital Currency, or CBDC for short, would be a digital version of the US Dollar (USD). In other words, the USD would become a government issued "cryptocurrency." In this case, the Federal Reserve, the guys who control our money, would issue and control a digital form of the US dollar. It would be sizably different from, say, a decentralized Bitcoin, or other cryptocurrencies since a US CBDC would be backed by our government. The goal would be to get the best of both worlds, the convenience of digital money and the stability of traditional cash. The Good The concept of a digital US dollar is certainly intriguing. In the era where rapid transactions are the expectation, a digital currency has the potential to transform how we manage our finances. The ability to expedite transactions at a faster rate could be a game-changer for both individuals and businesses, not just domestically but internationally as well. A more rapid, digital form of the US dollar could strengthen its standing on the global stage, maintaining its status as a world reserve currency. As more transactions move online, having a digital dollar keeps the US current and relevant, allowing the currency to adapt to the changing landscape of global finance helping secure its world reserve status. Furthermore, a digital dollar could potentially foster financial inclusivity. It's a currency form that doesn't require a traditional bank, offering financial services to those who are currently unbanked. This could lead to greater economic equality. Moreover, it might make government benefit distribution more efficient and direct, possibly reducing instances of fraud. However, it's important to keep in mind some potential roadblocks. For instance, Federal Reserve Board Governor Michelle Bowman has expressed concerns about the effectiveness of digital currencies in solving issues of financial exclusion. Barriers like limited internet access or lack of mobile devices would be a real problem. The Bad As promising as a digital dollar may seem, the associated challenges and risks should not be taken lightly. The idea of a digital US dollar might seem like the logical "next step," but there's one significantly scary downside to consider - a potential hit to our personal freedoms. This is a significant issue. Think about it this way-- the government would have an even bigger microscope on our money. In fact, we've seen something like this already. Do you remember in early 2022 when Canadian Prime Minister Justin Trudeau made the decision to stop payments to striking truckers? This is an alarming example of government overreach. The move, which disrupted the financial support of individuals exercising their right to strike, led to questions about the limits of governmental authority versus individual rights. This incident sparked fears of a future where personal financial transactions could be controlled or halted by the government under specific circumstances. So, imagine if something like that happened here in the US, but on an even larger scale. With a digital dollar, the government could keep tabs on our transactions and, technically speaking, have the power to turn off our money tap—for any reason (e.g., political, religious, etc.). That's a serious concern, and it raises big questions about how much control we're willing to hand over in return for the convenience of a digital dollar. Another one of the most pressing concerns is the potential for financial instability. If people all at once converted their savings to digital dollars during a crisis, it could create a similar situation to a bank run, and thereby weaken the banking system. Privacy and cybersecurity concerns also loom in a big way. Digital systems also come with an increased risk of cyberattacks, and a breach in a digital dollar system could potentially compromise a vast amount of financial data. And, as mentioned prior, privacy issues arise from the increased visibility of transaction data that digital dollars would enable, as it could potentially allow the government or other entities to track individuals' financial activities more closely than is currently possible. So, striking a balance between leveraging the potential benefits and mitigating the associated risks of a digital US dollar requires careful thought and prudent management. How far are we from a Digital US Dollar? The short answer? It's hard to say. The creation of a CBDC, or a digital US dollar, is contingent on multiple aspects, encompassing technical viability, policy directives, regulatory frameworks, and the overall societal preparedness for such a transformation. Each of these is a major hurdle to cross. The big dogs at the US Federal Reserve are teaming up with the brainiacs at MIT to build the tech needed for a possible digital dollar. The Fed's head, Jerome Powell, is big on taking it slow and doing things right, rather than rushing to get it out there, which is music to my ears. At the same time, there's this group called the Digital Dollar Project, backed by Accenture and the Digital Dollar Foundation, that went public in 2021 about running five pilot programs to test out how a US digital currency could work. Plus, President Joe Biden dropped an executive order looking into whether a US digital currency makes sense for our country. The government's adversarial role against crypto banks and exchanges (i.e., ChokePoint 2.0) tell me that the US has already made up its mind and will have a CBDC. It's coming. Now, don't hold your breath for a launch date for this digital buck, because the studies and pilot programs are still in full swing. But one thing's for sure - if a digital currency does happen in a big economy like ours, it's going to take a few years to roll out once we decide to hit the gas. What are the potential implications for the stock market? The introduction of a digital US dollar could have a significant impact on the stock market and the trading community. Here's a look at some potential effects based on the limited information provided in the resources.
Conclusion The digital US dollar is a thrilling idea, isn't it? Imagine zippy transactions, greater financial inclusivity, and a stronger global position for our currency - exciting stuff! But let's not forget, there could be a flip side. The big concern is the potential for Big Brother watching our financial transactions even closer. Losing our freedom is a major issue. That level of government control is not good any way you slice it. We've also got concerns about destabilizing the banking system, increased risk of cyberattacks, and privacy issues. While we're moving forward, it's crucial we strike a balance between the exhilarating advancements and potential risks. As for when we'll see a digital dollar, well, there's still a long road ahead. With the Fed, MIT, and others working on it, it seems like we're on track. But let's take it slow and get it right - we're in no rush to give up our freedoms for a faster—more modernized dollar. Des Woodruff [email protected] 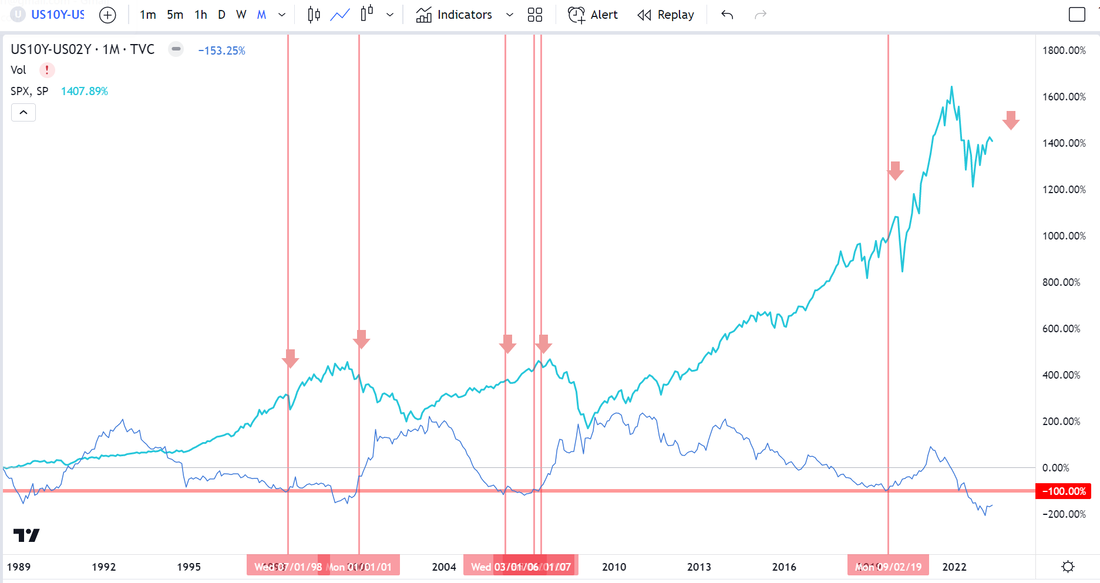 Well, it’s 2023, and it appears we have a lot more market downside to endure. If you’re keeping a close eye on the stock market, you may have heard the term “yield curve inversion” being tossed around lately. But what exactly does it mean, and why does it matter? A yield curve is like a line graph that shows how much interest you would earn if you invested in different types of bonds with different maturities. Long-term bonds, such as 10-year bonds, typically pay higher interest rates than short-term bonds, such as 2-year bonds, to compensate investors for tying up their money for a longer period. A yield curve inversion happens when this relationship is flipped, and the interest rates on long-term bonds, such as the 10-year bond, become lower than those on short-term bonds. This means that investors are more worried about the short-term economic outlook and are willing to accept lower returns on longer-term bonds to protect their money from potential losses in the future. The inversion of the yield curve is seen as a warning sign of a highly potential economic downturn, as it suggests that investors are pessimistic about the future and are seeking safer investments. This is a significant indicator of a likely economic downturn. In fact, every time this inversion has occurred since 1980, it has been followed by a recession, making it a reliable predictor of an economic downturn. However, it’s important to note that the timing and duration of these recessions can vary. For example, the recession that followed the 2006 yield curve inversion was not immediate and lasted from December 2007 to June 2009. IMPORTANT: See the chart below. Each vertical red line indicates the end of a bond-yield inversion. Anytime this occurs, a recession always follows. The effect on the market is severe. Historical data shows the average market drop during the past six inversion crashes was a whopping -28.4% for the S&P and -40.4% for the Nasdaq. This can be a scary prospect for investors, especially those who are new to the stock market or who may not have experienced a major multi-year market dip. Tradingview chart: The teal line is the SPX (S&P-500) price and the thin blue line is the bond yield curve between the 10-year and 2-year bonds. Anytime the bond yield curve line dips below the thick red horizontal lines, a rare bond yield inversion occurs and should be noted. We’re currently in a historically deep bond yield inversion. The real concern is when the inversion comes to an end. The bond yield curve has turned upward and heading towards ending the inversion. The question is how long it will take for the recession to sink in thereafter and for the markets to take their next leg downward. Our estimate is that the drop could start as early at Q4 of 2023 or could hold off to Q1 or even Q2 of 2024. Regardless, another 30-40% market drop, and the expected double-digit unemployment will be a shock to the economic system. It’s important to remember that there are ways to potentially mitigate risk during times of market turbulence. For example, some investors may choose to diversify their portfolios or invest in sectors that tend to be less affected by economic downturns. Another strategy is to learn how to trade the markets effectively. While trading the markets carries risk, having a solid understanding of how they work and knowing how to read market trends can potentially help investors make more informed decisions and minimize their risk. 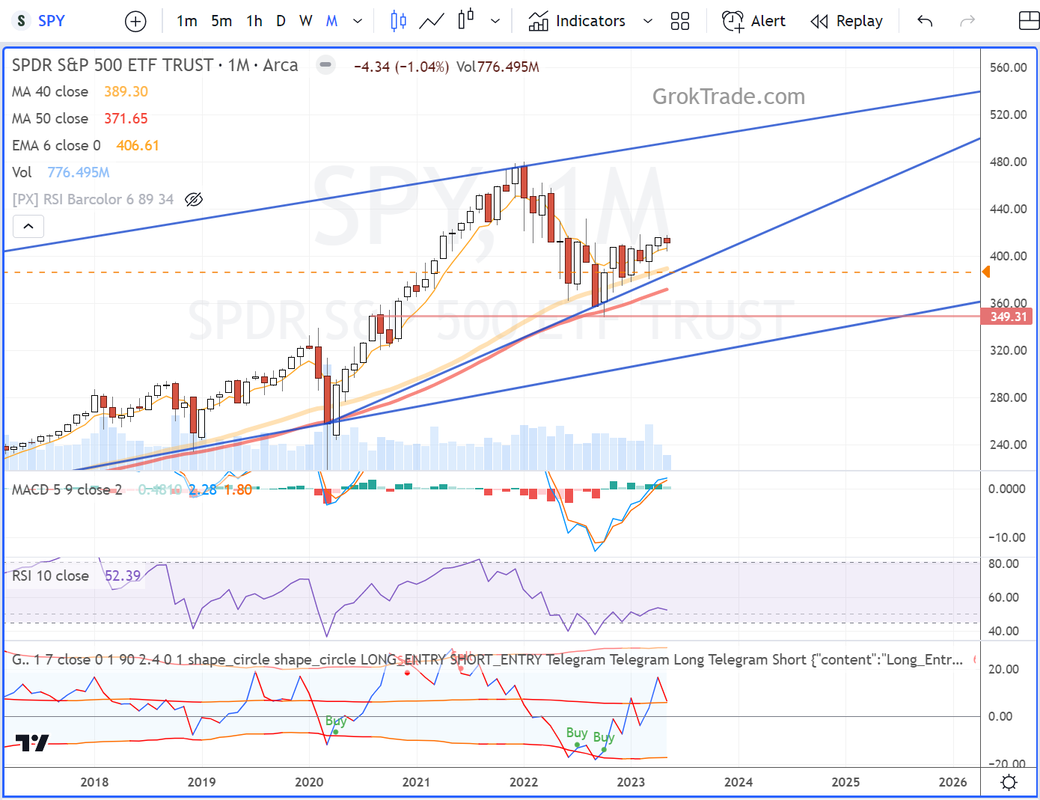 The Tradingview chart above is a monthly chart of the SPY (S&P-500 ETF). It’s in a bearish rising wedge trend reversal pattern and showing a bearish flag set up too. Furthermore, the Grok ROC algorithm, bottom of the chart, is about to plot a SELL signal. The many bearish technical signals confirm what the bond yield inversion is warning. Unfortunately, we’re set up to experience a lot of upcoming economic pain.
We do not have to be fearful. As an owner of an education company that specializes in teaching stock trading, I firmly believe that education is the key to success in the stock market. By teaching our students how to read market trends, identify opportunities, and manage risk, we are equipping them with the tools they need to succeed in any market condition.  By Des W Woodruff (aka d-seven)
As a seasoned stock trader (of 25 years) and enthusiastic supporter of cryptocurrencies, I’ve been closely observing the evolving landscape of digital currencies and their impact on the global financial ecosystem. The world is advancing in technology. Central banks worldwide are increasingly realizing the need to innovate by developing their own digital currencies. This strategic move aims to maintain their competitiveness while also safeguarding their national currencies’ status within the international monetary sphere. A growing number of countries, including Japan, the European Union, and China, are already forging ahead with their CBDC projects. The significance of innovation in this context is paramount. Embracing cutting-edge technology and evolving with the times is crucial for central banks to stay relevant and adapt to the shifting demands of consumers and businesses alike. By spearheading the development of digital currencies, central banks can create a more efficient, secure, and accessible financial infrastructure that caters to the needs of a progressively digital society. BUT this innovation comes at a cost. A USD digital currency will make our big government—even bigger and with much more control. (Another subject for a different time). Fostering innovation in the realm of digital currencies can spur economic growth by enabling seamless cross-border transactions, reducing transaction costs, and promoting financial inclusion for unbanked and under-banked populations. Ultimately, central banks that champion innovation and adapt to the rapidly changing landscape of digital currencies will be better positioned to maintain their competitiveness and uphold the global standing of their respective currencies. If you haven’t heard about the so-called “Operation Choke Point 2.0,” yet, you likely will soon. Choke Point 2.0 has caught my attention, as it seems to be a coordinated effort by the U.S. government to restrict access to essential financial services for cryptocurrency companies. This move raises concerns that the U.S. administration might be responsible for the recent collapse of crypto-friendly banks such as Silicon Valley Bank, Signature Bank, and Silvergate Bank. By impeding the growth and development of the cryptocurrency sector, the government’s actions may ultimately be counterproductive to their own objectives. The jury is out on this one. A primary concern here is the need to maintain the competitiveness of the U.S. dollar and preserve its status as the world’s reserve currency. The preservation of the USD is critical for the U.S. and all living within its borders. In a rapidly evolving global financial landscape, it is essential for the United States to embrace the digital revolution and adopt a digital dollar to remain competitive. And we better do this right, or the repercussions could be dire. The America losing the world reserve status would be devastating. On this note, it’s technically within the U.S.’s interest to stifle any growth and adoption of digital currencies outside of the digital USD. All crypto are now deemed competitors and the U.S. will fight hard to maintain its global monetary status. Furthermore, the government’s aggressive actions may discourage innovation in the financial sector, which is crucial for the growth and progress of the U.S. economy. By hindering the development of digital currencies, the U.S. administration may inadvertently push businesses and investors toward other jurisdictions that are more welcoming to the growing cryptocurrency industry. Such an exodus would negatively impact the domestic economy, as the country loses valuable talent, expertise, and investment. Concerns surrounding Operation “Choke Point 2.0” are not unfounded, as the government’s actions in restricting access to financial services for cryptocurrency companies may ultimately undermine their goals of ensuring the USD’s competitiveness and preserving its world reserve status. As I stated, it is critical for the U.S. to recognize the importance of innovation and adopt a more progressive stance toward digital currencies to maintain its position as a global economic leader. As a proponent of cryptocurrency, I believe the U.S. risks it’s global monetary status (either today or tomorrow) if a competing country, like China, establishes a digital currency that other countries recognize and trust before the USD becomes properly digitized. I do not want to see America lose its world reserve status. And for this reason, I can’t blame my government for trying to choke out its competitors. Bitcoin and Ethereum are indeed competitors, and formidable competitors at that. In the long run, fostering innovation and collaboration with the cryptocurrency sector could prove beneficial for the U.S. economy and help preserve the USD’s global prominence. By demonstrating a willingness to adapt to the rapidly changing financial landscape, the U.S. could ensure that it remains at the forefront of digital finance and secures its position as a global economic leader. Des W Woodruff  Boosting trading profits using technology is real-- very real!
In this blog, we explore the ways in which artificial intelligence (AI) can revolutionize the world of investing and help traders win more profits. From real-time analysis and insights to automation of manual tasks and democratization of financial markets, AI has the power to transform the trading industry. And it's happening before our eyes. Because you're in the Grok ecosystem, you're benefiting by being in the know. AI truly has the potential to revolutionize the world of investing by providing traders with faster and more accurate analysis, enabling better and faster decision making. In this post, we will explore some of the key ways in which AI can help traders win more profits when investing. One of the main ways in which AI helps traders is by providing real-time analysis and insights. By analyzing vast amounts of data and identifying patterns and trends that may not be visible to humans, AI can help traders to make more informed and confident decisions. This can lead to better performance and increased profits. AI can also help to eliminate human bias and error, leading to more objective and fair decision making. This can be especially useful in situations where emotions or personal beliefs may cloud judgment. Another way in which AI can help traders to win more profits is by automating many manual and time-consuming tasks, freeing up human traders to focus on higher-value work. This can help to increase efficiency and reduce costs, leading to lower fees and more accessible financial products and services for consumers. In addition, the integration of AI into the trading industry can help to democratize access to financial markets and level the playing field for small and underbanked communities. This can provide more individuals with the opportunity to participate in the financial system and potentially achieve financial success. AI can also help traders to better understand and anticipate customer needs and preferences, leading to more personalized and effective financial products and services. This can help to increase customer satisfaction and loyalty, leading to increased profits. While AI has the potential to bring many benefits to the trading industry, it is important to recognize that it also brings challenges and risks. These may include job displacement, ethical considerations, and the need for new regulations and policies. It is important to carefully consider these issues and to use AI responsibly and ethically in order to maximize its benefits and minimize its potential negative impacts. Overall, AI has the power to transform the trading industry by providing faster and more accurate analysis, automating manual tasks, and democratizing access to financial markets. By leveraging the benefits of AI, traders can increase their chances of winning more profits when investing. Using the power of AI, we developed our own advanced AI-powered trading algorithms to help our users. With real-time analysis and automation capabilities, our algorithms can help you make more informed and confident decisions, leading to improved performance and increased profits. Don't hesitate on utilizing this technology. Frankly, it will "revolutionize" your trading strategy. Flexing the power of AI, d7 PS. If you want to take a peak click here: Grok Algos Exploring the Benefits of Algorithmic Trading: How Trading Algos Can Improve Efficiency and Returns1/3/2023  If you have been researching the world of trading, you may have heard about algorithmic trading or trading algos. But what exactly are they and how can they benefit traders like you? In this article, we delve into the world of artificial intelligence (AI) in trading and how algorithmic trading can benefit us, including better trade setup identification, more efficient trade execution, the ability to remove emotions from the trading process, portfolio diversification, and the potential to reduce transaction costs. Whether you are a seasoned trader or new to the game, this article is a must-read for anyone looking to improve their trading performance. Savvy traders must consider implementing AI into their trading to stay competitive in the financial markets. AI in finance is best used in trading algos, also known as automated trading or black box trading, which are sophisticated computer programs that execute trades based on predetermined rules. These rules, referred to as trading algorithms or trading algos, can be based on various factors, such as chart pattern setups, technical indicators, statistical models, and market conditions. One of the primary benefits of using trading algos is the increased speed and efficiency of trade setup identification. With the processing power of AI, traders can take advantage of buy/sell trading signals derived by trading algos as they arise. This can be especially useful when searching for the best trade setups packed with the greatest odds. In addition to faster trade setup identification, trading algos can help traders remove those pesky emotions from the trading process. Emotions are the Achilles' heel to traders. It can be difficult to stick to a predetermined trading strategy when emotions are involved in traditional (manual) trading. However, trading algos follow a set of predetermined rules, sidestepping the problems emotions cause to weaken decision making. Trading algos can lead to more rational and informed trading decisions. Finally, trading algos also offer the advantage of portfolio diversification by allowing traders to execute trades across multiple timeframes, asset classes, and markets. The algorithmic computer program can monitor multiple markets simultaneously, enabling traders to take advantage of opportunities in different markets at the same time. This can help to lessen risk and likely increase returns. In conclusion, trading algos offer numerous benefits to traders, including faster and more efficient trade setup identification, the ability to remove emotions from the process, and portfolio diversification. While it is important to carefully consider the risks and limitations of automated trading, trading algos can be a valuable tool for traders looking to improve their trading performance. Ready to take your trading to the next level? Consider implementing trading algos into your strategy to enjoy the benefits of faster and more efficient trade setup identification, the ability to remove emotions from the process, and portfolio diversification. Don't miss out on the opportunity to improve your trading performance – adopt AI into your trading today! d7 PS. See the 2023 best trading algos here: https:groktrade.com/algo PSS. Extra bonus points for posting your comment below. :) :) :)  Artificial intelligence (AI) has been making waves in the finance industry for quite some time now. From automating routine tasks to improving the accuracy of risk assessment, AI has the potential to revolutionize the way financial institutions operate.
One of the primary ways that AI is being used in finance is through the use of machine learning algorithms. These algorithms are able to analyze vast amounts of data and identify patterns and trends that would be impossible for a human to spot. This allows financial institutions to make more informed decisions, such as identifying fraudulent activity or predicting market trends. Another area where AI is making a big impact is in the realm of personal finance. Many companies are now offering AI-powered financial management tools that can help individuals better understand and manage their personal finances. For example, some AI systems can analyze a person's spending habits and suggest ways to save money, while others can help individuals create and stick to a budget. AI is also being used to improve the efficiency of financial transactions. For example, some banks are using AI to automate the process of onboarding new customers, which can be a time-consuming and resource-intensive task. By automating this process, banks can reduce the time and resources required to onboard new customers, allowing them to focus on other areas of the business. Finally, AI is being used to improve the accuracy of risk assessment in the finance industry. By analyzing historical data and identifying patterns, AI systems can help financial institutions better predict and mitigate risks, such as credit defaults or market fluctuations. Overall, AI is transforming the way financial institutions operate and is poised to have a significant impact on the industry in the coming years. As AI technology continues to advance, we can expect to see even more innovative uses of this technology in the finance sector. So, the use of AI in finance is increasing day by day and it is playing a vital role in the finance industry. (The above was written 100% by AI. Crazy, right?) This is now Des (aka d7). I simply asked ChatGPT to write me a blog article on AI in finance and this is what it produced and it did so in 15 seconds. As an educator in the world of trading using technical analysis, I am shouting from the rooftops for all of us who are active traders in the live markets to start leveraging AI in your trading today. START USING AI IN YOUR TRADING TODAY. Do NOT wait! This technology is moving at lightening speed. The financial world will quickly be divided into those using AI vs those who are not. By using AI, you will benefit in two ways:
This is the easy way to put AI in your corner: groktrade.com/algo |
Des Woodruff (aka d-seven)
Archives
July 2024
Categories |
 RSS Feed
Copyright © 2007-2024 Free Trading Videos.com, Inc. dba Grok Trade | All Rights Reserved
U.S. Government Required Disclaimer - Stocks, ETFs, mutual funds, commodities, bonds, futures, options and any securities trading has large potential rewards, but also a large potential risk. You must know the risks and be willing to accept them to invest in the securities markets. Do not risk capital you cannot afford to lose completely. This website is neither a solicitation nor an offer to Buy/Sell any security. No representation is being made that any account will or is likely to achieve profits or losses similar to those discussed on this website. The past performance of any trading system or method is not necessarily indicative of future results. Users should consult with their own professional investment, tax and portfolio advisers before making any decisions in investing and should independently verify all information on any sites or products by Free Trading Videos.com, Inc dba Grok Trade.
We emphasize that no information set forth on this website is an invitation to trade any specific investments. Trading requires risking money in pursuit of future gain. That is your decision. Do not risk any money you cannot afford to lose. This website does not take into account your own individual financial and personal circumstances. It is intended for educational purposes only and NOT as individual investment advice. Do not act on this information without advice from your investment professional, who you should expect to determine what is suitable for your particular needs and circumstances. Failure to seek detailed professional, personally-tailored advice prior to making any investment could result in actions contrary to your best interests and loss of capital.
*CFTC RULE 4.41(b)(1)/NFA RULE 2-29 - SIMULATED OR HYPOTHETICAL PERFORMANCE RESULTS HAVE CERTAIN INHERENT LIMITATIONS. UNLIKE THE RESULTS SHOWN IN AN ACTUAL PERFORMANCE RECORD, THESE RESULTS DO NOT REPRESENT ACTUAL TRADING. ALSO, BECAUSE THESE TRADES HAVE NOT ACTUALLY BEEN EXECUTED, THESE RESULTS MAY HAVE UNDER-OR-OVER COMPENSATED FOR THE IMPACT, IF ANY, OF CERTAIN MARKET FACTORS, SUCH AS LACK OF LIQUIDITY. SIMULATED OR HYPOTHETICAL TRADING PROGRAMS IN GENERAL ARE ALSO SUBJECT TO THE FACT THAT THEY ARE DESIGNED WITH THE BENEFIT OF HINDSIGHT. NO REPRESENTATION IS BEING MADE THAT ANY ACCOUNT WILL OR IS LIKELY TO ACHIEVE PROFIT OR LOSSES SIMILAR TO THOSE BEING SHOWN.
NO REPRESENTATION IS BEING MADE THAT ANY PERSON WILL OR IS LIKELY TO ACHIEVE PROFITS OR LOSSES SIMILAR TO THOSE SHOWN. IN FACT, THERE ARE FREQUENTLY SHARP DIFFERENCES BETWEEN HYPOTHETICAL PERFORMANCE RESULTS AND THE ACTUAL RESULTS SUBSEQUENTLY ACHIEVED BY ANY PARTICULAR TRADING PROGRAM.
IN ADDITION, HYPOTHETICAL TRADING DOES NOT INVOLVE FINANCIAL RISK, AND NO HYPOTHETICAL TRADING RECORD CAN COMPLETELY ACCOUNT FOR THE IMPACT OF FINANCIAL RISK IN ACTUAL TRADING. FOR EXAMPLE, THE ABILITY TO WITHSTAND LOSSES OR TO ADHERE TO A PARTICULAR TRADING PROGRAM IN SPITE OF TRADING LOSSES ARE MATERIAL POINTS WHICH CAN ALSO ADVERSELY AFFECT ACTUAL TRADING RESULTS. THERE ARE NUMEROUS OTHER FACTORS RELATED TO THE MARKETS IN GENERAL OR TO THE IMPLEMENTATION OF ANY SPECIFIC TRADING PROGRAM WHICH CANNOT BE FULLY ACCOUNTED FOR IN THE PREPARATION OF HYPOTHETICAL PERFORMANCE RESULTS AND ALL OF WHICH CAN ADVERSELY AFFECT ACTUAL TRADING RESULTS.