
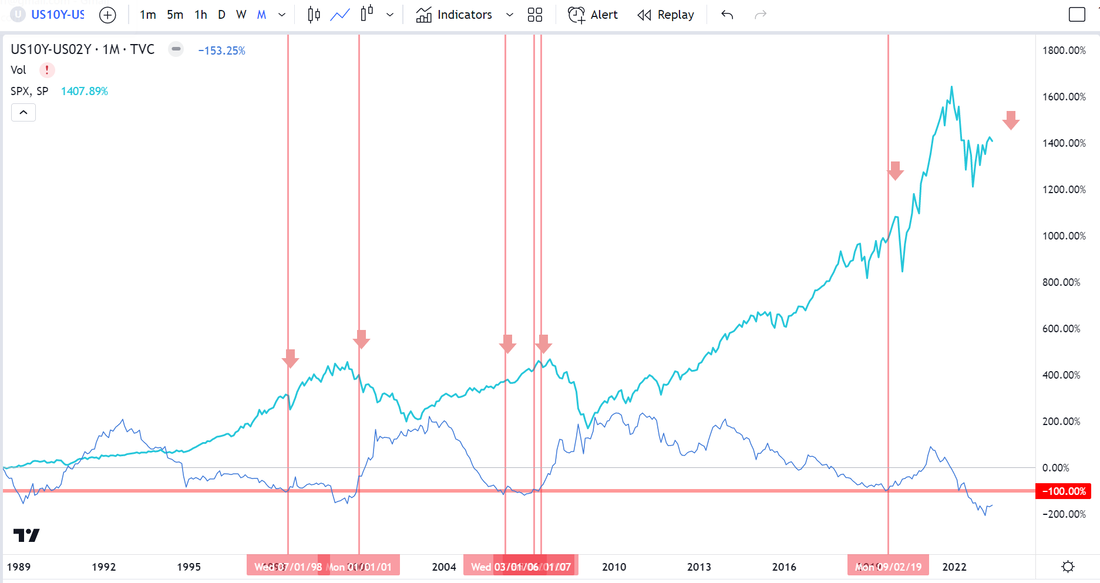
 Well, it’s 2023, and it appears we have a lot more market downside to endure. If you’re keeping a close eye on the stock market, you may have heard the term “yield curve inversion” being tossed around lately. But what exactly does it mean, and why does it matter? A yield curve is like a line graph that shows how much interest you would earn if you invested in different types of bonds with different maturities. Long-term bonds, such as 10-year bonds, typically pay higher interest rates than short-term bonds, such as 2-year bonds, to compensate investors for tying up their money for a longer period. A yield curve inversion happens when this relationship is flipped, and the interest rates on long-term bonds, such as the 10-year bond, become lower than those on short-term bonds. This means that investors are more worried about the short-term economic outlook and are willing to accept lower returns on longer-term bonds to protect their money from potential losses in the future. The inversion of the yield curve is seen as a warning sign of a highly potential economic downturn, as it suggests that investors are pessimistic about the future and are seeking safer investments. This is a significant indicator of a likely economic downturn. In fact, every time this inversion has occurred since 1980, it has been followed by a recession, making it a reliable predictor of an economic downturn. However, it’s important to note that the timing and duration of these recessions can vary. For example, the recession that followed the 2006 yield curve inversion was not immediate and lasted from December 2007 to June 2009. IMPORTANT: See the chart below. Each vertical red line indicates the end of a bond-yield inversion. Anytime this occurs, a recession always follows. The effect on the market is severe. Historical data shows the average market drop during the past six inversion crashes was a whopping -28.4% for the S&P and -40.4% for the Nasdaq. This can be a scary prospect for investors, especially those who are new to the stock market or who may not have experienced a major multi-year market dip. Tradingview chart: The teal line is the SPX (S&P-500) price and the thin blue line is the bond yield curve between the 10-year and 2-year bonds. Anytime the bond yield curve line dips below the thick red horizontal lines, a rare bond yield inversion occurs and should be noted. We’re currently in a historically deep bond yield inversion. The real concern is when the inversion comes to an end. The bond yield curve has turned upward and heading towards ending the inversion. The question is how long it will take for the recession to sink in thereafter and for the markets to take their next leg downward. Our estimate is that the drop could start as early at Q4 of 2023 or could hold off to Q1 or even Q2 of 2024. Regardless, another 30-40% market drop, and the expected double-digit unemployment will be a shock to the economic system. It’s important to remember that there are ways to potentially mitigate risk during times of market turbulence. For example, some investors may choose to diversify their portfolios or invest in sectors that tend to be less affected by economic downturns. Another strategy is to learn how to trade the markets effectively. While trading the markets carries risk, having a solid understanding of how they work and knowing how to read market trends can potentially help investors make more informed decisions and minimize their risk. 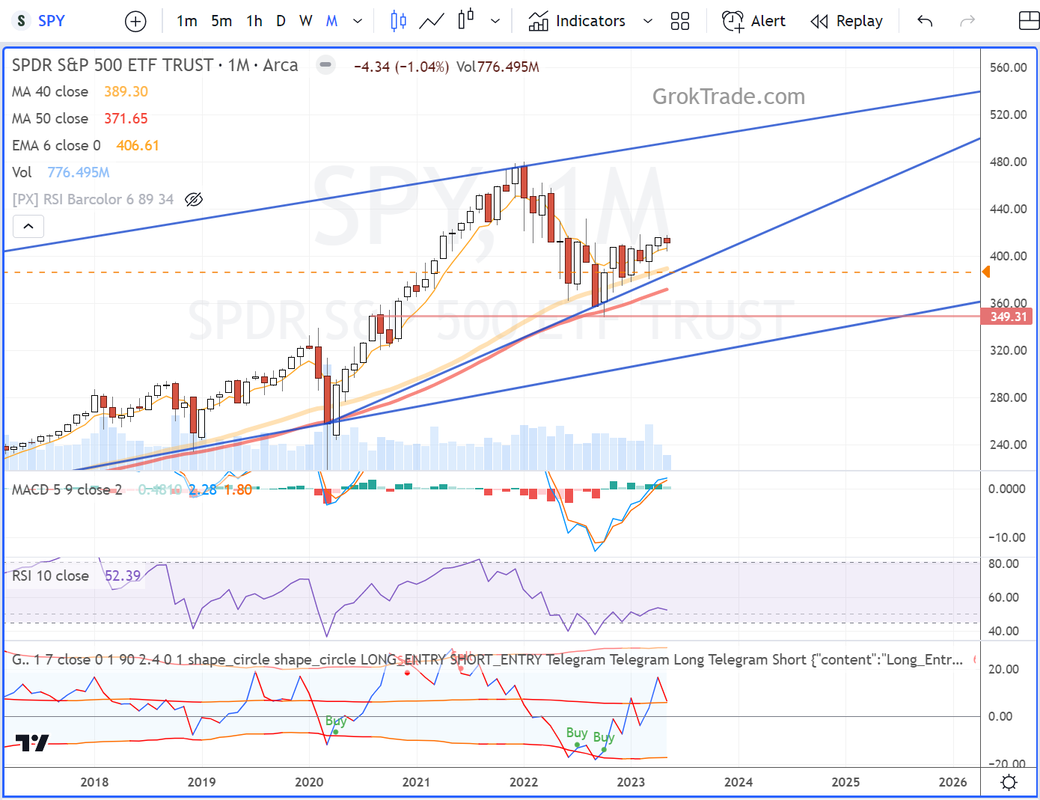 The Tradingview chart above is a monthly chart of the SPY (S&P-500 ETF). It’s in a bearish rising wedge trend reversal pattern and showing a bearish flag set up too. Furthermore, the Grok ROC algorithm, bottom of the chart, is about to plot a SELL signal. The many bearish technical signals confirm what the bond yield inversion is warning. Unfortunately, we’re set up to experience a lot of upcoming economic pain.
We do not have to be fearful. As an owner of an education company that specializes in teaching stock trading, I firmly believe that education is the key to success in the stock market. By teaching our students how to read market trends, identify opportunities, and manage risk, we are equipping them with the tools they need to succeed in any market condition.
0 Comments
|
Des Woodruff (aka d-seven)
Archives
July 2024
Categories |
 RSS Feed
Copyright © 2007-2024 Free Trading Videos.com, Inc. dba Grok Trade | All Rights Reserved
U.S. Government Required Disclaimer - Stocks, ETFs, mutual funds, commodities, bonds, futures, options and any securities trading has large potential rewards, but also a large potential risk. You must know the risks and be willing to accept them to invest in the securities markets. Do not risk capital you cannot afford to lose completely. This website is neither a solicitation nor an offer to Buy/Sell any security. No representation is being made that any account will or is likely to achieve profits or losses similar to those discussed on this website. The past performance of any trading system or method is not necessarily indicative of future results. Users should consult with their own professional investment, tax and portfolio advisers before making any decisions in investing and should independently verify all information on any sites or products by Free Trading Videos.com, Inc dba Grok Trade.
We emphasize that no information set forth on this website is an invitation to trade any specific investments. Trading requires risking money in pursuit of future gain. That is your decision. Do not risk any money you cannot afford to lose. This website does not take into account your own individual financial and personal circumstances. It is intended for educational purposes only and NOT as individual investment advice. Do not act on this information without advice from your investment professional, who you should expect to determine what is suitable for your particular needs and circumstances. Failure to seek detailed professional, personally-tailored advice prior to making any investment could result in actions contrary to your best interests and loss of capital.
*CFTC RULE 4.41(b)(1)/NFA RULE 2-29 - SIMULATED OR HYPOTHETICAL PERFORMANCE RESULTS HAVE CERTAIN INHERENT LIMITATIONS. UNLIKE THE RESULTS SHOWN IN AN ACTUAL PERFORMANCE RECORD, THESE RESULTS DO NOT REPRESENT ACTUAL TRADING. ALSO, BECAUSE THESE TRADES HAVE NOT ACTUALLY BEEN EXECUTED, THESE RESULTS MAY HAVE UNDER-OR-OVER COMPENSATED FOR THE IMPACT, IF ANY, OF CERTAIN MARKET FACTORS, SUCH AS LACK OF LIQUIDITY. SIMULATED OR HYPOTHETICAL TRADING PROGRAMS IN GENERAL ARE ALSO SUBJECT TO THE FACT THAT THEY ARE DESIGNED WITH THE BENEFIT OF HINDSIGHT. NO REPRESENTATION IS BEING MADE THAT ANY ACCOUNT WILL OR IS LIKELY TO ACHIEVE PROFIT OR LOSSES SIMILAR TO THOSE BEING SHOWN.
NO REPRESENTATION IS BEING MADE THAT ANY PERSON WILL OR IS LIKELY TO ACHIEVE PROFITS OR LOSSES SIMILAR TO THOSE SHOWN. IN FACT, THERE ARE FREQUENTLY SHARP DIFFERENCES BETWEEN HYPOTHETICAL PERFORMANCE RESULTS AND THE ACTUAL RESULTS SUBSEQUENTLY ACHIEVED BY ANY PARTICULAR TRADING PROGRAM.
IN ADDITION, HYPOTHETICAL TRADING DOES NOT INVOLVE FINANCIAL RISK, AND NO HYPOTHETICAL TRADING RECORD CAN COMPLETELY ACCOUNT FOR THE IMPACT OF FINANCIAL RISK IN ACTUAL TRADING. FOR EXAMPLE, THE ABILITY TO WITHSTAND LOSSES OR TO ADHERE TO A PARTICULAR TRADING PROGRAM IN SPITE OF TRADING LOSSES ARE MATERIAL POINTS WHICH CAN ALSO ADVERSELY AFFECT ACTUAL TRADING RESULTS. THERE ARE NUMEROUS OTHER FACTORS RELATED TO THE MARKETS IN GENERAL OR TO THE IMPLEMENTATION OF ANY SPECIFIC TRADING PROGRAM WHICH CANNOT BE FULLY ACCOUNTED FOR IN THE PREPARATION OF HYPOTHETICAL PERFORMANCE RESULTS AND ALL OF WHICH CAN ADVERSELY AFFECT ACTUAL TRADING RESULTS.